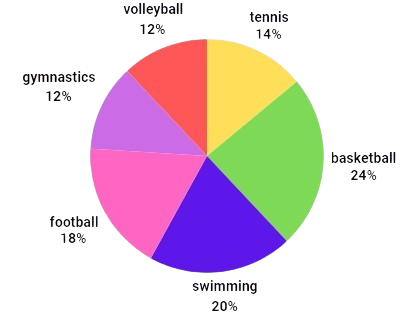
Γράφημα πίτας ή γράφημα
Το γράφημα πίτας είναι ένας τύπος γραφήματος που παρουσιάζει τη σχέση των διαφορετικών μερών ενός συνόλου δεδομένων.
Το γράφημα πίτας είναι ένα κυκλικό γράφημα που χωρίζεται σε φέτες (ή τμήματα) και κάθε τμήμα αντιπροσωπεύει ένα ποσοστό των δεδομένων.
Παράδειγμα: Διάγραμμα πίτας που δείχνει το αγαπημένο άθλημα των παιδιών. Αυτό το διάγραμμα πίτας αντιπροσωπεύει 50 παιδιά.


