Pie graph or chart
A pie chart is a type of graph that presents the relationship of different parts a data set.
A pie chart is a circular graph, divided into slices (or sections), where each section represents a percentage of the data.
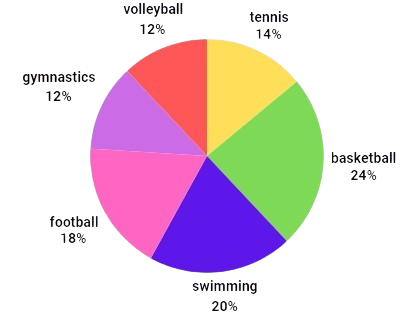
Example: A pie chart to show children’s favourite sport. This pie chart represents 50 children.

 |
– The pie chart gets its name from its appearance. It resembles a pie that has been cut into different sized slices.
– The size of each slice is proportional to the data it represents.
– Using a pie chart you can easily show your data as a percentage of a whole data set! |
